Performance Diagnostics and Monitoring

Screenshot of a browser monitor dashboard

Don't lose another order! Ensure your site works.

Screenshot of a browser monitor dashboard
  • Track and optimize website speed to improve Google rankings.
  • Easily assess your server's health.
  • Track Core Web Vitals and other performance metrics.
  • Uncover sporadic and periodic degradation in your site's performance.
  • Automatically delegate issues to different team members.
  • Amazing customer support.
START NOW!
OR
Try our FREE Uptime Monitoring plan

Core product benefits

  • Covers all the failure points in the user journey.
  • Provides early warnings for performance degradation.
  • Delegates issues on a policy basis, so the right member of your team gets notified.
  • Designed to scale: can accommodate any project of any size.
  • Every page is a live dashboard.
  • Collects historical data on the performance of your pages.

Use cases

  • Uptime monitoring.
  • Full webpage monitoring.
  • Performance monitoring.
  • Web Vitals monitoring.
  • SSL monitoring.
  • API endpoint monitoring.

Unparalleled insights

Our advanced video and waterfall displays show you exactly what's slowing down your page, making it easy to fix page speed problems.

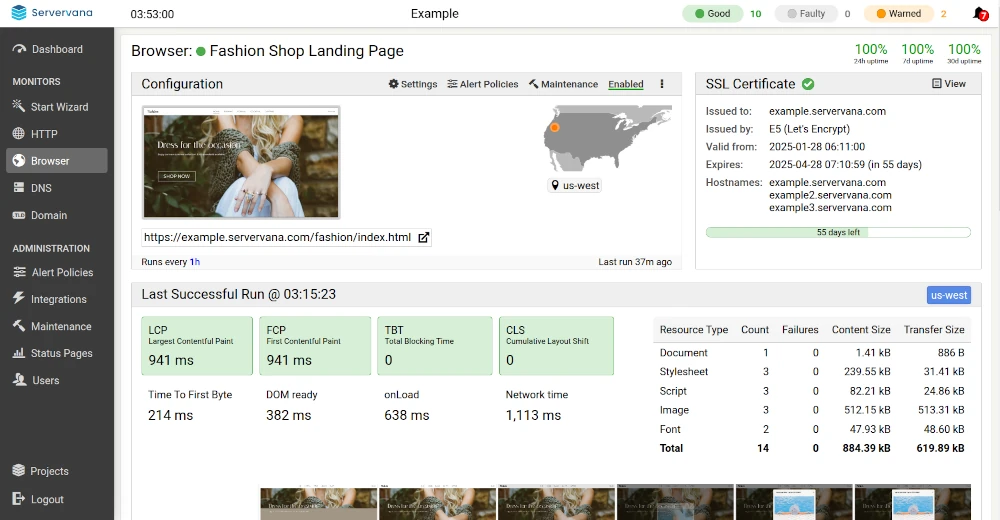
  • See exactly how your pages are loading.
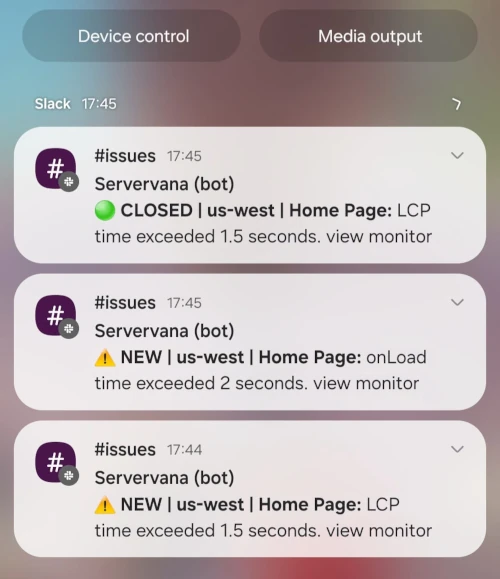
  • Immediately discover what needs improving.
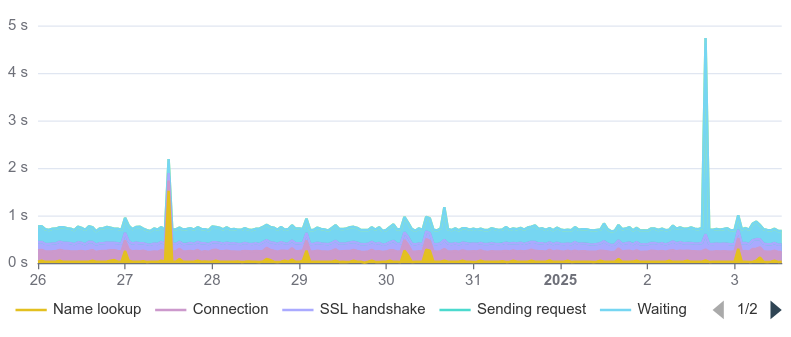
  • Track performance over time.
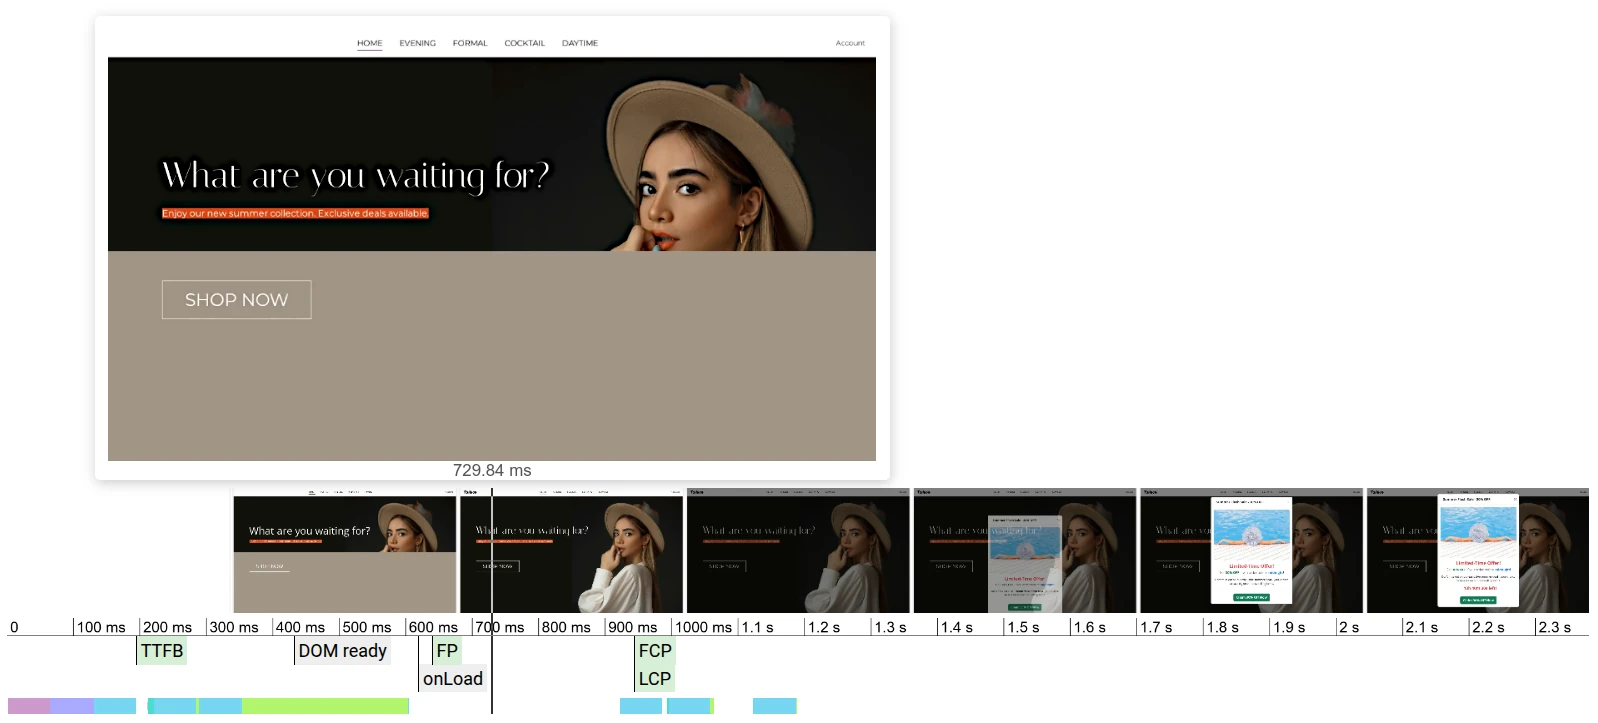
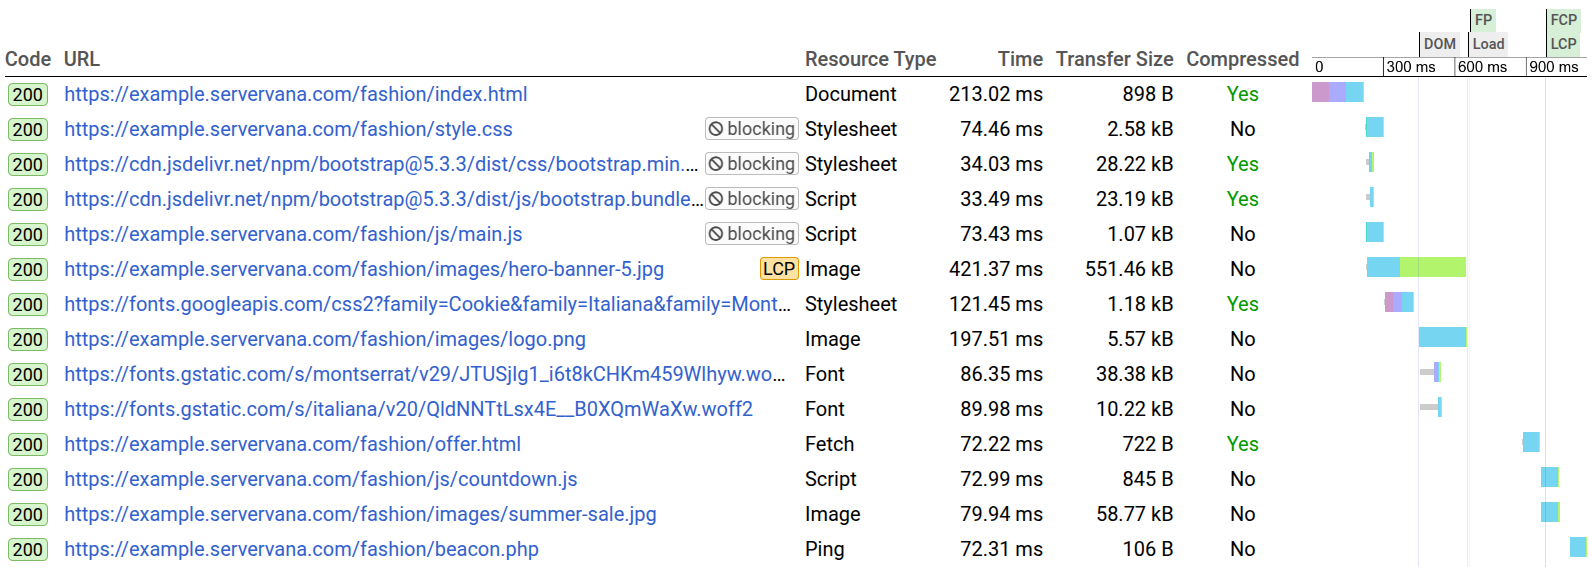
Visual breakdown of how a webpage loads Waterfall display showing which requests are blocking painting

We have the most advanced video strip view in the industry and we coupled it with a waterfall display that offers truly useful information about why the page is loading the way it does, providing an intuitive understanding of the loading process and the available optimization opportunities.

Highly powerful uptime and API endpoint monitoring

  • Track the health of your website and endpoints, and reveal which step of the request is creating issues.
  • Catch spurious and periodic issues that would otherwise only be visible to your users.
  • Validate redirection chains (ex: non-WWW to www, HTTP to HTTPs, etc), DNS records and SSL certificates.
Graph generated by an HTTP monitor showing the kind of detailed insight that it can provide